
In the last few years, analyst evaluations have evolved from “nice-to-have” visibility assets into core strategic milestones that shape how buyers perceive emerging vendors. According to Forrester’s State of Business Buying 2024 report 86% of B2B purchases stall during the buying process due to complexity, long cycles, and friction — which makes third-party validation via analyst reports like Gartner Market Guides, Magic Quadrants, Forrester Waves, Omdia Universe, and IDC MarketScapes more influential than ever. These reports carry enormous weight not just with enterprise procurement teams but also with investors, partners, and category influencers. This shift underscores why building a Perfect Analyst Relations Presentation Deck has become critical.
Yet what many founders and GTM leaders don’t realize is this:
Your analyst deck often determines how analysts interpret your product, category fit, and differentiation for the next 12 months.
In a Gartner or Forrester briefing, analysts rely heavily on the deck you present — not to evaluate your design quality, but to evaluate your strategic clarity. A strong analyst deck gives analysts the right inputs to accurately represent you in reports and buyer inquiries. A weak one confuses them, reduces evaluation confidence, and can even exclude you from coverage.
But most companies — especially early-stage SaaS, cybersecurity, AI, DevOps, and infrastructure vendors — get the analyst deck wrong. They reuse sales decks, overstuff slides with features, and tell incoherent stories that analysts can’t map to their research frameworks.
This guide is your complete blueprint for building a world-class analyst deck that impresses Gartner, Forrester, IDC, Omdia, Everest Group, and every major firm—a true Perfect Analyst Relations Presentation Deck.
You’ll learn:
What an analyst deck really is
Why analysts evaluate decks differently from buyers or investors
The 10-slide structure analysts prefer
What mistakes companies make
Best practices that improve analyst clarity
Real B2B examples
A ready-to-use deck template
And a checklist to validate your deck before any briefing
Let’s begin.
What Makes an Analyst Deck Different from a Sales or Investor Deck
Analyst decks are not sales decks. They’re not investor decks. And they’re not pitch decks.
Analyst decks exist for exactly one purpose:
To give analysts the data, clarity, and narrative structure they need to understand your company’s strategic position in the market.
Here’s how the three deck types differ:
Analyst Deck vs Sales Deck vs Investor Deck
Element | Analyst Deck | Sales Deck | Investor Deck |
Audience | Analysts & advisory firms | Prospects | Investors |
Objective | Educate + align narrative | Convert | Raise capital |
Focus | Clarity, category fit, roadmap, differentiation | Value props, ROI, features | Market size, growth, financials |
What they evaluate | Strategy, ICP, proof, realism | Product fit, outcomes | Economics, scalability |
Story flow | Problem → ICP → Differentiation → Proof → Roadmap | Problem → Value → Demo → Social proof | Problem → Market → Team → Traction → Ask |
Detail level | High on buyer behavior, product architecture, roadmap | High on demo, outcomes | High on metrics |
Slide count | 8–12 | 10–15 | 12–20 |
Why this matters
If you walk into an analyst briefing with a sales deck, analysts immediately flag:
- “Too feature-heavy.”
- “Unclear market positioning.”
- “Weak category alignment.”
If you walk in with an investor deck, they think:
- “Where is the buyer story?”
- “Why is all the data financial?”
- “This feels like fundraising, not strategy.”
Analysts want market truth, not polished hype.
The Anatomy of a Perfect Analyst Deck (10-Slide Breakdown)
This slide sequence is based on thousands of analyst briefings across top B2B categories.
It hits exactly what analysts expect — in the right order.
Below, each slide includes:
✔ What analysts want
✔ What analysts hate
✔ Common B2B mistakes
✔ Best practices
✔ Real examples
✔ Structure to use
Slide 1 — Market Problem
This is the most important slide of the entire deck.
Analysts want clarity on:
- What problem you solve
- Why the problem exists
- Which buyer feels it
- How painful it is
- What triggers the buyer to act
- Why this problem matters now
❌ Mistake Companies Make
“We improve efficiency”
“We drive visibility”
“We simplify complexity”
These are useless to analysts — because every vendor claims them.
✔ Best Practice
Anchor in specific, measurable, vertical-relevant pain.
B2B Example (DevOps)
“Teams spend 40–70% of engineering cycles on CI/CD troubleshooting because pipelines lack observability and automated rollbacks.”
Structure
- Clear buyer pain
- Trend shaping the problem
- Data-backed urgency
- Cost of inaction
Slide 2 — Category & Market Context
Analysts need to map you inside existing frameworks.
If you don’t define your category clearly, analysts will define it for you — and not always in your favor.
✔ Analysts look for
- Category alignment
- Adjacent markets
- Segments you serve
- Clarity about what you’re not
❌ Common Mistake
“Inventing new categories” too early.
Analysts reject categories without existing buyer demand.
B2B Example (AI security)
Wrong: “We created the AI TrustOps category.”
Right: “We sit between MLOps and AppSec, providing model security across training and inference.”
Structure
- Category you fit
- Subcategory or niche
- How category is evolving
- Where you sit in analyst framework
Slide 3 — ICP & Buyer Persona
Analysts consider this one of the top indicators of maturity.
✔ Analysts want
- Precise ICP
- Vertical
- Organizational maturity
- Buyer roles
- User personas
❌ Mistake
“We can sell to any mid-market or enterprise company.”
This signals immaturity.
B2B Example (HRTech)
Right: “250–5,000 employee companies adopting multi-country payroll with high compliance complexity.”
Structure
- What segment
- Which vertical
- Buyer role
- User role
- Trigger events
Slide 4 — Product Overview
Analysts want the capability story, not a feature dump.
✔ Analysts want
- High-level architecture
- Core workflows
- Key capabilities
- Buyer impact
❌ Mistakes
- 20+ feature screenshots
- Deep-dive demos
- Roadmap masquerading as features
B2B Example (Cybersecurity)
Right: “We provide endpoint, identity, and lateral movement detection using behavioral ML trained on 8B weekly events.”
Structure
- What your product does
- How it works
- Why it solves the problem uniquely
- Workflow illustration
Slide 5 — Differentiation
Analysts absolutely care about this slide.
They want:
- 3–5 differentiators
- Specific, defendable claims
- Proof for each claim
❌ Worst Mistake
Using generic claims like:
- AI-powered
- Unified platform
- Single pane of glass
- Enterprise-grade
Analysts roll their eyes at these.
B2B Example (Fintech)
Differentiator: “99.97% reconciliation accuracy for multi-entity general ledgers due to automated multi-ledger mapping.”
Structure
- Differentiator
- Why it matters
- Proof point
- Impact on buyer
Slide 6 — Competitive Landscape
Analysts are already mapping you against competitors — this slide helps them do it accurately.
✔ Analysts want
- Landscape
- Category adjacency
- Who you displace
- Why you’re better
❌ Mistake
Attacking competitors aggressively.
Analysts see this as insecurity.
B2B Example (Cloud observability)
Right: “We sit between APM and log analytics, replacing tools when teams struggle with cardinality costs.”
Structure
- Quadrant or landscape
- 3–5 key differentiators
- Why customers switch
Slide 7 — Proof Points (Evidence of Value)
Analysts prioritize real customer evidence over everything else.
✔ Analysts want
- Usage metrics
- Adoption curves
- Retention
- Time-to-value
- Vertical-specific ROI
❌ Mistake
Using vanity metrics (downloads, signups, impressions).
B2B Example (MarTech)
“OPM increased conversion by 32% across 4 enterprise brands within 90 days of deployment.”
Structure
- ROI
- Usage
- Deployment metrics
- Operational outcomes
Slide 8 — Case Studies
Analysts expect depth, not fluff.
✔ Analysts want
- Context
- Problem
- Deployment
- Outcomes
- Metrics
- Buyer quotes
❌ Mistake
Shallow case studies like:
“Customer improved efficiency with our solution.”
B2B Example (Logistics)
A freight visibility platform doubled ETA accuracy for a top-5 retailer → reduced detention time by 18%.
Structure
- Background
- Pain
- Implementation
- Result
- Data
Slide 9 — Product Roadmap
Analysts evaluate roadmap realism to assess your maturity.
✔ Analysts want
- 12–18 month vision
- Believable milestones
- Prioritization logic
- Customer-driven enhancements
❌ Mistake
Cramming in 25 roadmap items with no rationale.
B2B Example (Enterprise SaaS)
Right: “Q4: Role-based access control. Q1: multi-entity reporting for shared services. Q2: ML-enabled anomaly detection.”
Structure
- Near-term
- Mid-term
- Strategic bets
Slide 10 — Vision
Analysts want your perspective on the future of the category.
✔ Analysts want
- How the market will evolve
- How buyer behavior will change
- What challenges emerge
- Where your product leads
❌ Mistake
“We will be the leading platform in our space.”
Meaningless.
B2B Example (AI SaaS)
Right: “In 3 years, AI-assisted workflows will reduce manual decision-making by 30–45%. Our platform becomes the orchestration layer for those workflows.”
Structure
- Macro trend
- Future buyer needs
- Your thesis
- Your role in the future
Full Analyst Deck Template (Copy/Paste)
Slide 1 — Market Problem
Slide 2 — Category & Market Context
Slide 3 — ICP & Buyer Persona
Slide 4 — Product Overview
Slide 5 — Differentiation
Slide 6 — Competitive Landscape
Slide 7 — Proof Points
Slide 8 — Case Studies
Slide 9 — Roadmap
Slide 10 — Vision
Common Mistakes Companies Make in Analyst Decks
Here are the 10 mistakes that destroy analyst clarity:
- Using a sales deck
- Too many features
- No clear ICP
- Vague differentiation
- No customer evidence
- Overselling or overclaiming
- Unrealistic roadmap
- Crowded slides
- Founder not involved
- Defensive competitive stance
Each of these signals immaturity to analysts.
Best Practices for a High-Trust Analyst Deck
- Keep slides clean
- Use analyst category language
- Anchor everything in buyer problems
- Present as founder + PMM
- Bring real proof
- Show roadmap realism
- Use simple graphics
- Follow narrative sequencing
- Rehearse the story
- Always leave time for Q&A
The 3-Story Framework Analysts Prefer
Analysts evaluate vendors through a very different lens than buyers or investors. They are not looking for excitement or vision alone — they are looking for clarity, proof, and forward credibility. The 3-Story Framework aligns precisely with how analysts process information and assess long-term relevance.
Use this framework consistently across all 10 slides of your analyst deck to ensure your narrative is easy to follow, remember, and reference.
1. Truth — Market Reality and Category Placement
Truth establishes context. Analysts need to immediately understand who you are, where you fit, and why the problem matters now.
This story should clearly answer:
What market problem are you solving?
Which category do you belong to?
Who is the buyer and user?
Why does this problem exist today?
Why current approaches fall short
When Truth is clear, analysts don’t have to guess or reinterpret your positioning. They can quickly map you to their research frameworks and buyer inquiries.
2. Traction — Evidence That You’re Real
Traction converts claims into credibility. Analysts are skeptical by design — proof is what earns attention and trust.
This story should include:
Referenceable customer outcomes
Measurable ROI or impact metrics
Adoption and usage signals
Logos or segments (honest and defensible)
Clear examples of value delivered
Traction tells analysts: this works in the real world, not just on slides.
3. Trajectory — Direction, Momentum, and Market Fit
Trajectory answers the most important analyst question: “Will this vendor matter in the future?”
This story should show:
Roadmap priorities tied to market evolution
Strategic bets and why they matter
How you expect buyer needs to change
What differentiates your future position
What you will not do (focus and discipline)
Trajectory gives analysts confidence to track you, reference you, and eventually include you in evaluations.
Why This Framework Works
When Truth, Traction, and Trajectory are presented in a clear sequence:
Analysts understand your category placement faster
Proof reinforces credibility without hype
Forward direction reduces perceived risk
The result is dramatically higher analyst clarity, better recall, and stronger representation in research, advisory calls, and reports.
Key Takeaway
Analysts don’t need more slides — they need a story they can retell accurately. The 3-Story Framework ensures your narrative is easy to understand today and easy to reference for months to come.
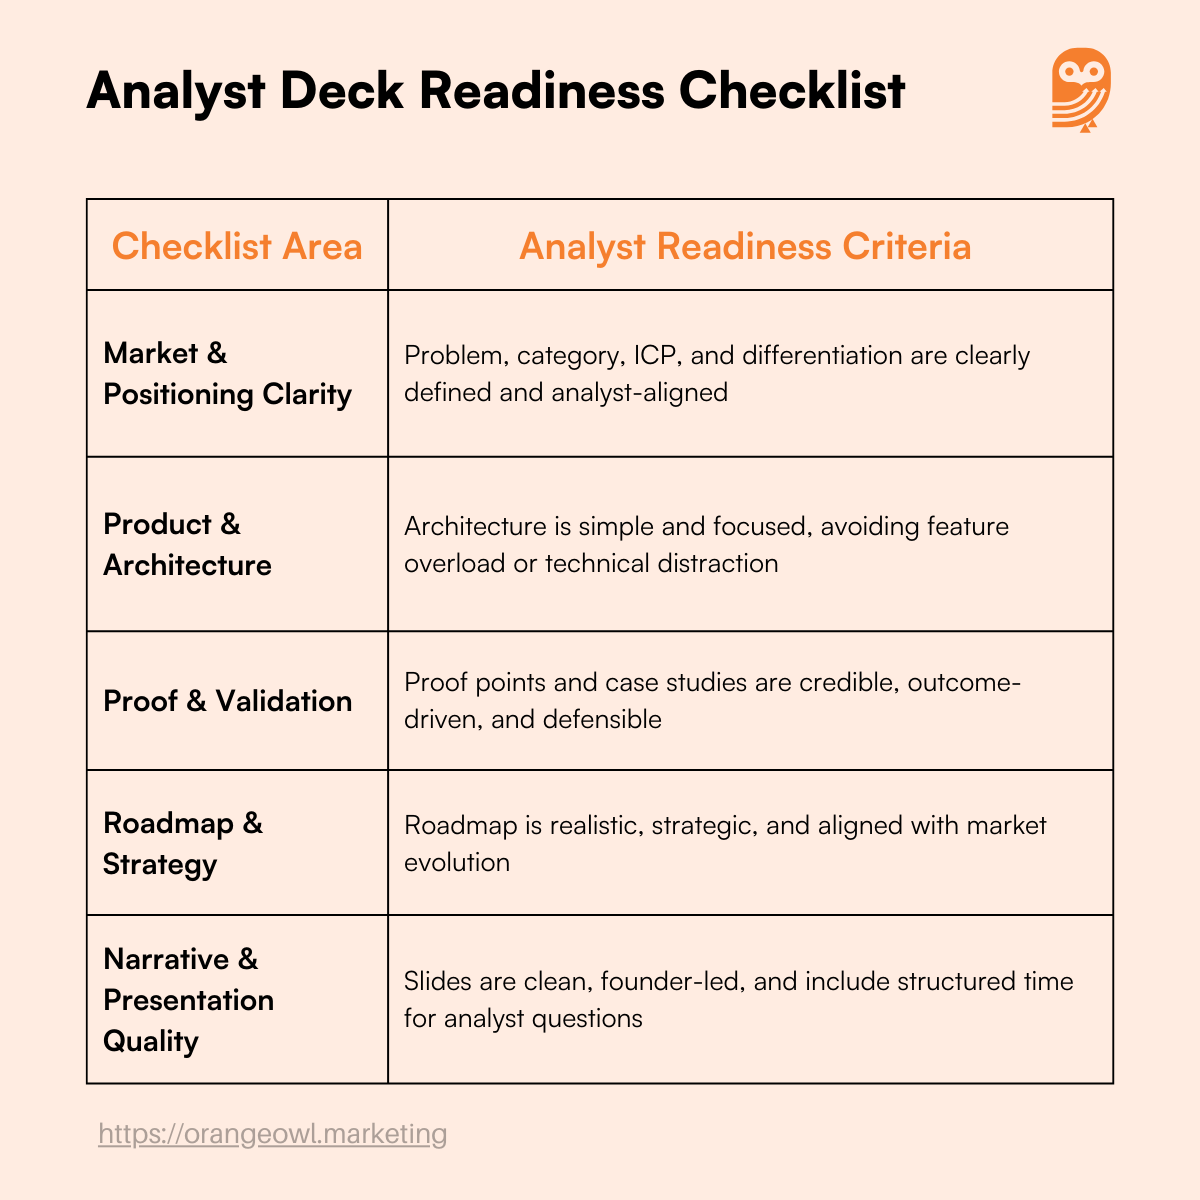
Checklist: Is Your Analyst Deck Ready?
Before every analyst briefing, this checklist should be reviewed line by line. Each item represents a common reason analysts either gain confidence—or walk away confused. A “yes” across most of these signals strong analyst readiness.
Market & Positioning Clarity
Problem is clear – The market problem is specific, urgent, and grounded in buyer reality
Category is defined – Analysts can immediately place you within an existing or emerging category
ICP is specific – Buyer persona, company size, and use case are tightly scoped
Differentiators are defensible – Differentiation is provable, not marketing language
Product & Architecture
Architecture is simple – High-level system view is understandable without deep technical walkthroughs
No feature overload – Capabilities support the story instead of distracting from it
Proof & Validation
Proof points are credible – Metrics are real, recent, and defensible under analyst questioning
Case studies are strong – Outcomes-focused customer examples validate value claims
No vanity metrics – Avoid inflated numbers that don’t reflect buyer impact
Roadmap & Strategy
Roadmap is realistic – Commitments align with execution history and delivery capacity
Vision is strategic – Future direction connects to market evolution, not just product expansion
Narrative & Presentation Quality
Slides are clean – Visuals reinforce clarity; no clutter, no unnecessary polish
Founder is part of narrative – Leadership vision and strategic ownership are visible
Q&A time included – Space is left for analyst questions, objections, and feedback
How to Use This Checklist
Review 48 hours before any analyst briefing
Flag weak areas and simplify, don’t add
Treat unanswered analyst questions as roadmap inputs
Key Takeaway
If your deck answers analyst questions before they ask them, you’ve done the work. Analyst-ready decks reduce friction, increase trust, and dramatically improve how you’re represented in research and buyer conversations.
Conclusion
A great analyst deck is not just a presentation — it’s a strategic asset that influences how Gartner, Forrester, IDC, and other firms evaluate your company for the next year. With a clear narrative, strong proof, realistic roadmap, and a simplified structure, your deck becomes a tool that drives alignment, credibility, and category leadership. This is the foundation of a Perfect Analyst Relations Presentation Deck.
Analysts don’t need perfect design — they need perfect clarity.
And this 10-slide structure gives you exactly that.