Struggling to make your B2B events stand out in this dynamic market?
Then you’re not alone!
The B2B event market is ever-changing, and it is difficult to stay afloat with the changing trends. So, to stay ahead of the curve you need data-driven strategies, and here’s where we come in with 111+ powerful B2B event statistics that will help you to generate leads, increase engagement, and supercharge your ROI. But before we dive deep into understanding the statistics, let us learn about event marketing.
What is Event Marketing?
Event marketing is a strategic process of developing a themed exhibit, presentation, or display to promote a service, product, brand, or cause. It is a strategy used by marketers to have an in-person engagement with their customers. These events can be conducted online or offline and the companies can participate as hosts, co-hosts, sponsors, or participants.
Is Event Marketing required?
Event marketing is one such strategy that helps companies in driving results. It can help in
- Building Brand Awareness
- Increasing Lead Generation
- Promoting Customer Engagement
- Upsell Customers
- Educating Prospects and Customers
What are the different kinds of Marketing Events?
Event marketing can be done through In-person and Online/Virtual events.
- Online Event Marketing:
- Online marketing events are less expensive when compared to offline marketing events. They offer global exposure, and it helps to address timely topics.
- Webinars and Live Streaming events are examples of online marketing events.
- In-person Marketing Events:
- In-person events are a powerful way to directly interact with the customer and connect with them on a personal level.
- Tradeshows, Conferences, Meetups, and Appreciation events are a few examples of in-person events.
Checkout the list of top B2B Marketing Events.
Top B2B Event Stats and Trends
- The Event Marketing Industry is set to reach $36.31 billion by 2026. – Daedal Research
- B2B events generate $1.1 trillion in direct spending globally. – Zipdo
- The Event Marketing Industry expects to post a 12.96% CAGR between now and 2026. – Daedal Research
- 83% of companies are charging or planning to charge attendance fees for large-scale events. – Kaltura
- 48% of attendees are willing to pay an attendance fee while 52% are reluctant to pay. – Kaltura
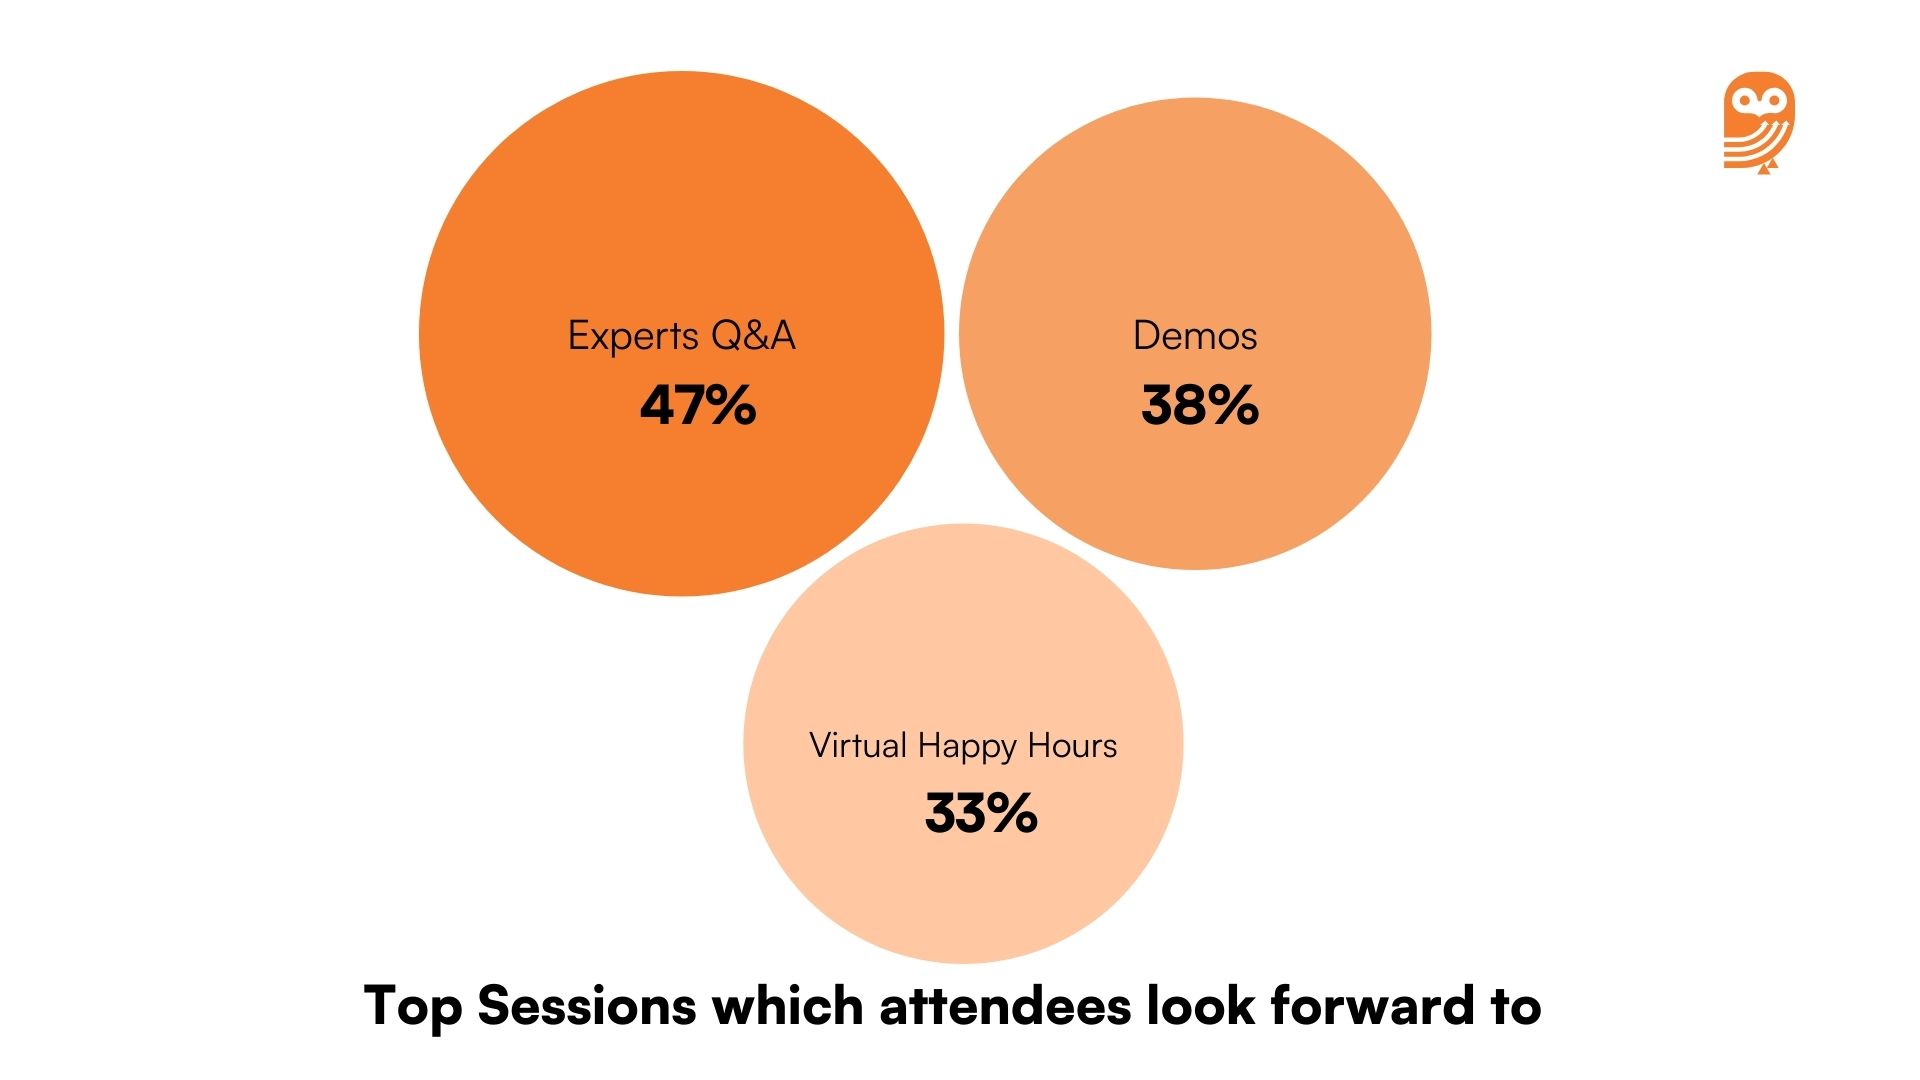
- The top sessions that attendees look forward to are
- The session types that attendees feel are most successful at helping them inform their buying decisions are
- 51% of non-event professionals spent around 10 to 39 hours per event creating, planning, and hosting internal events. – Splash
- The key to successful events is
- The majority of marketers are using generative AI to leverage the technology for event marketing. – LinkedIn
- Event sponsorship spending is estimated to reach $62.8 billion globally. – Zipdo
- 300% to 500% of ROI is realized by 48% of brands through event marketing. – FortuneBusinessInsights
Source: Kaltura
General Event Marketing Stats
- B2B events comprise the largest portion of the event marketing industry with a 40% share whereas B2C and other events together have a share of 60%. – Daedal Research
- Research states that 90% of large-scale events will be remote or hybrid soon. – Kaltura
- Pre-covid, on average the organizers hosted 4.85 in-person events. – Kaltura
- Post-covid we have seen that the average number of virtual events is 4.68. – Kaltura
- The survey data from Splash shows that 43% of marketers reported conducting some in-person and some virtual events, 30% conducted only in-person events, 11% conducted hybrid events, 9% conducted a mix of in-person, virtual, and hybrid, and only 6% conducted purely virtual events. – Splash
- 9/10 B2B marketers are convinced that buyers are suffering from “event fatigue”. – MarketingCharts
- According to a survey by Marketing Charts, 57% of respondents say that events are owned and managed by the marketing division, orchestrated across the company, and aligned to a holistic marketing plan. – MarketingCharts
- Type of event experiences according to attendees
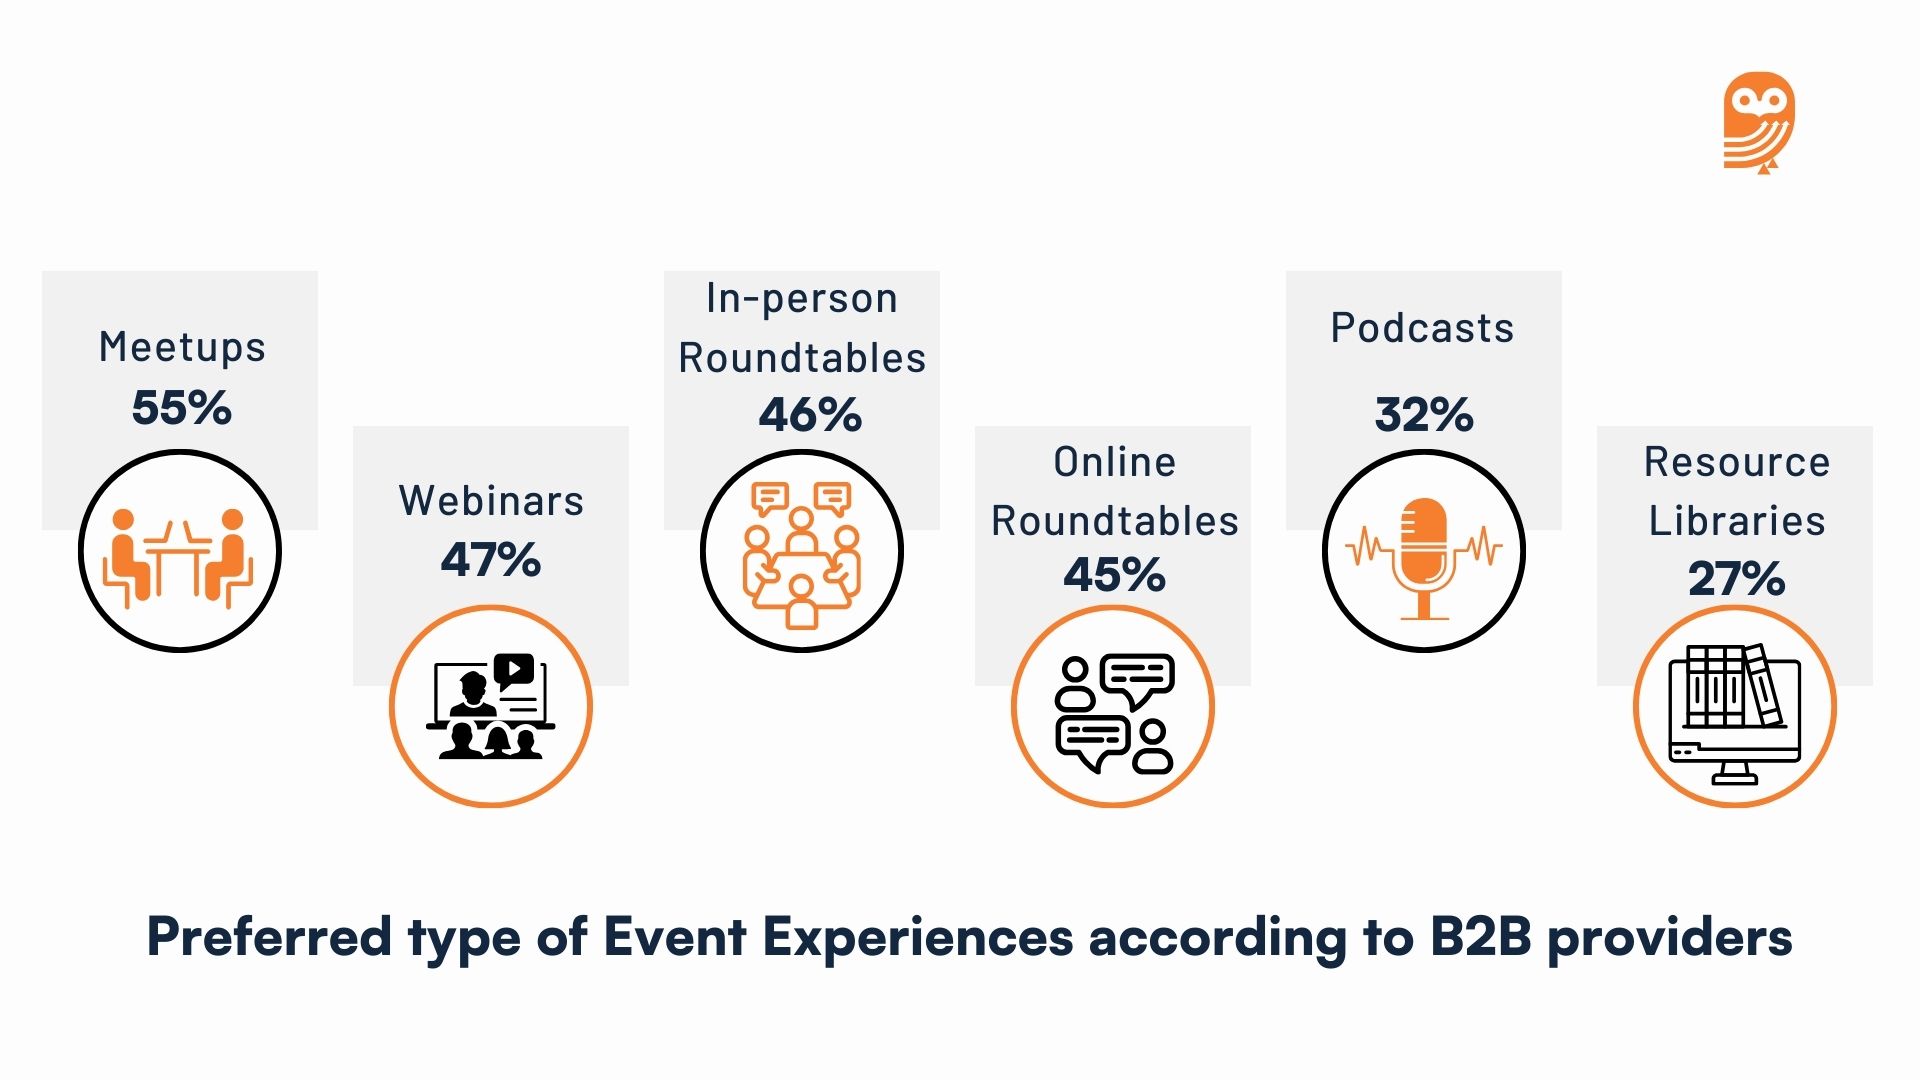
- Preferred type of event experiences according to B2B providers/Vendors
- 84% of the events are targeted toward current customers while less than half (41%) of events target prospective buyers, leaving a lot of untapped revenue potential. – Splash
- 81% of event practitioners would hold more events if they had access to the right set of tools. – Splash
- Post-COVID, 75% of attendees say that they’ll still attend virtual and hybrid events even after in-person events have fully resumed. – Kaltura
- 83% of marketers say that events help their companies to stand out from the competition. – Splash
Source: Emerald
Virtual Event Marketing Stats
Source: AnyRoad
- Since 2020 there has been an increase in virtual events from 46% to 51%. – Kaltura
- From 2021, 92% of companies have made a clear shift to virtual events. – Kaltura
- Prior to COVID-19, only 45% of people attended a virtual event but after that the number has jumped to 87%. – Kaltura
- 93% of attendees agreed that companies have done a good job in adapting to virtual events. – Kaltura
- 36% of participants attend virtual events to educate themselves about the brand or company. – Kaltura
- The top 3 benefits identified by organizers while choosing large-scale virtual events over in-person events are increased registrations (36%), greater ROI (26%) and greater attendee engagement (25%). – Kaltura
- The top benefits according to attendees, for attending large-scale virtual events are the ease of attending (67%) and cost-effectiveness (49%). – Kaltura
- 77% of organizers say that the top challenge for them when it comes to post-event operations of large-scale virtual events is integrating data into their CRM. – Kaltura
- 55% of attendees say that the top drawback of large-scale virtual events is that they feel less personal. – Kaltura
- 44% of attendees agree that virtual events offer fewer opportunities to socialize. – Kaltura
- 35% of attendees face challenges in networking when virtual events are conducted. – Kaltura
- 22% of attendees also agree that building business relationships through virtual events is challenging. – Kaltura
- The top desired element of virtual events according to attendees is having the same experience as in-person attendees (44%). – Kaltura
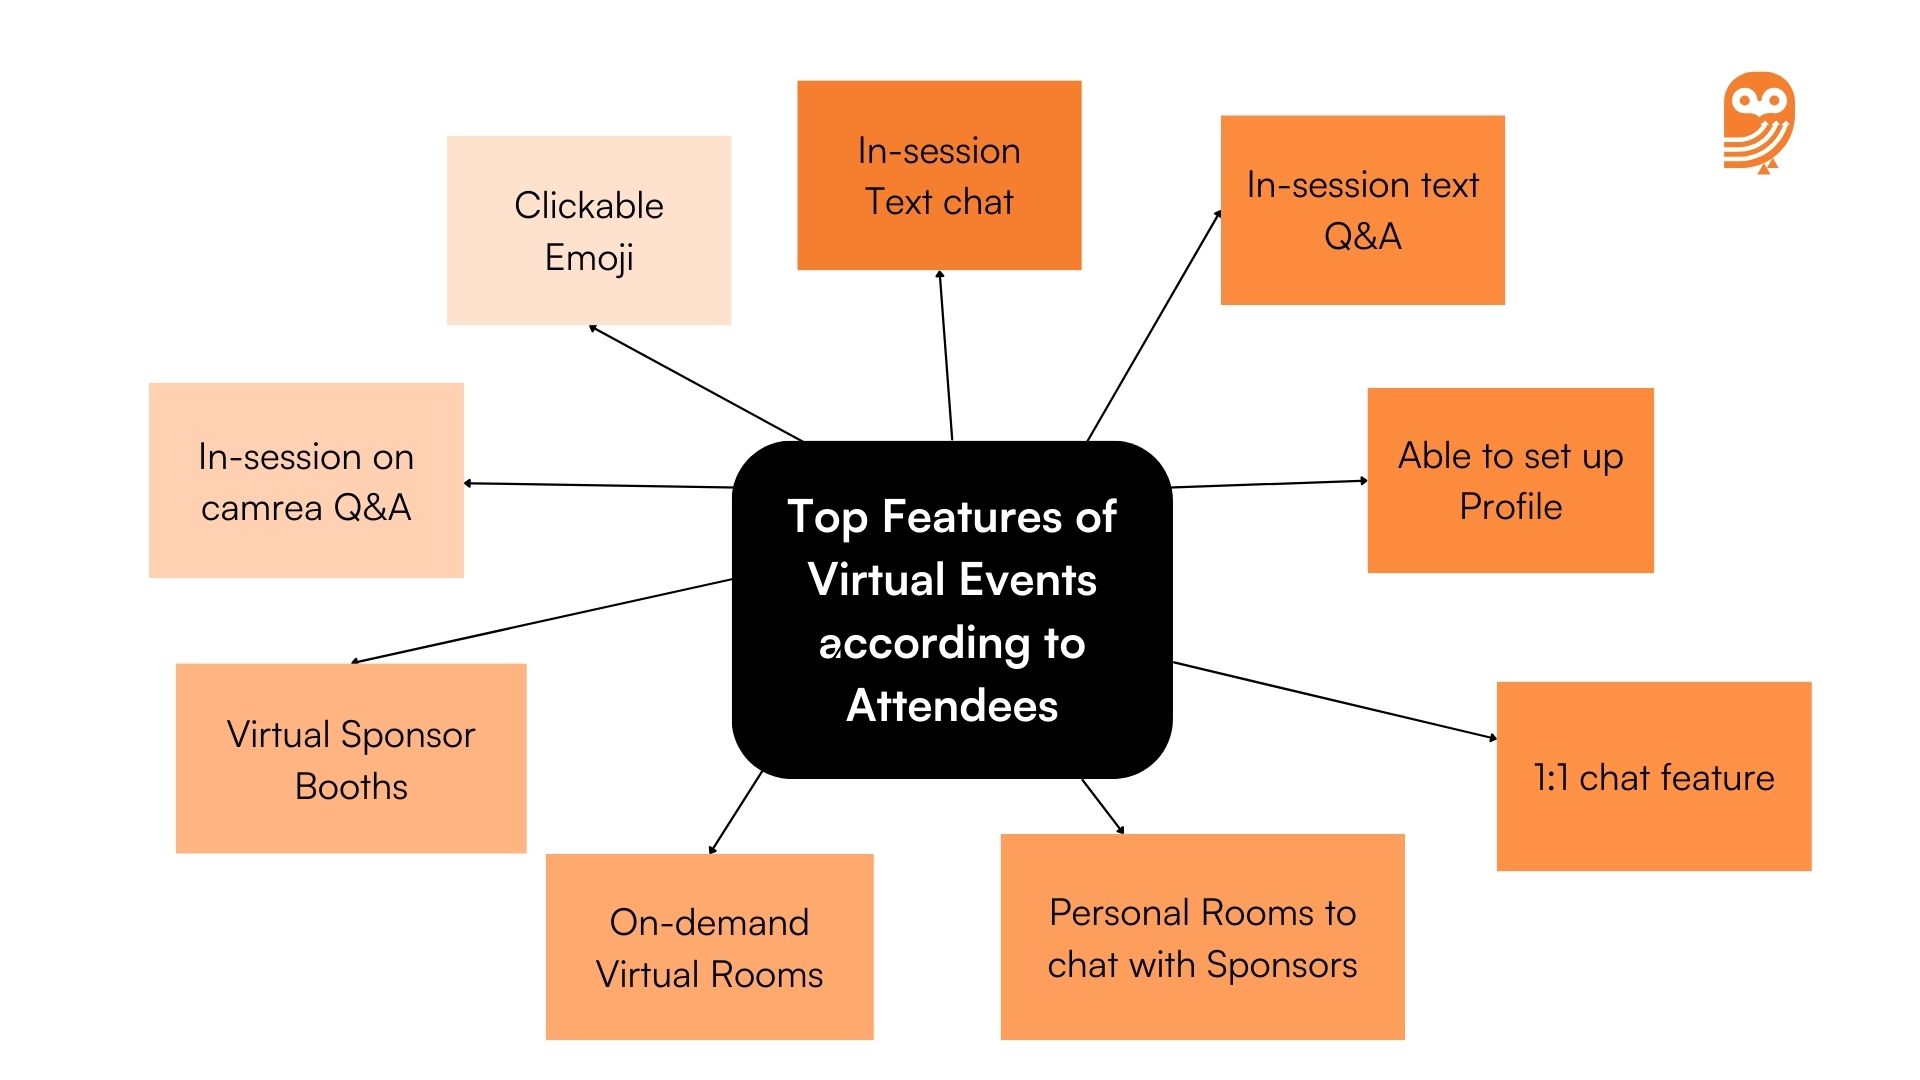
- The top features of virtual platforms according to attendees are:
- In-session text chat (91%) – Kaltura
- In-session text Q&A (90%) – Kaltura
- Able to set up their profile so that attendees can find and connect during the virtual event (85%) – Kaltura
- 1:1 chat feature with attendees outside of sessions (82%) – Kaltura
- Personal rooms where one can chat on-camera with sponsors (76%) – Kaltura
- Clickable emoji reaction during the session (74%) – Kaltura
- On-demand virtual rooms to meet with other attendees on-camera (74%) – Kaltura
- Virtual sponsor booths (70%) – Kaltura
- In-session on-camera Q&A (69%) – Kaltura
- Only 12% of marketers believe that they are confident in executing virtual events. – MarketingCharts
- 46% of marketers feel that they do not have sufficient measurement tools to show the full impact of their virtual events. – Anyroad
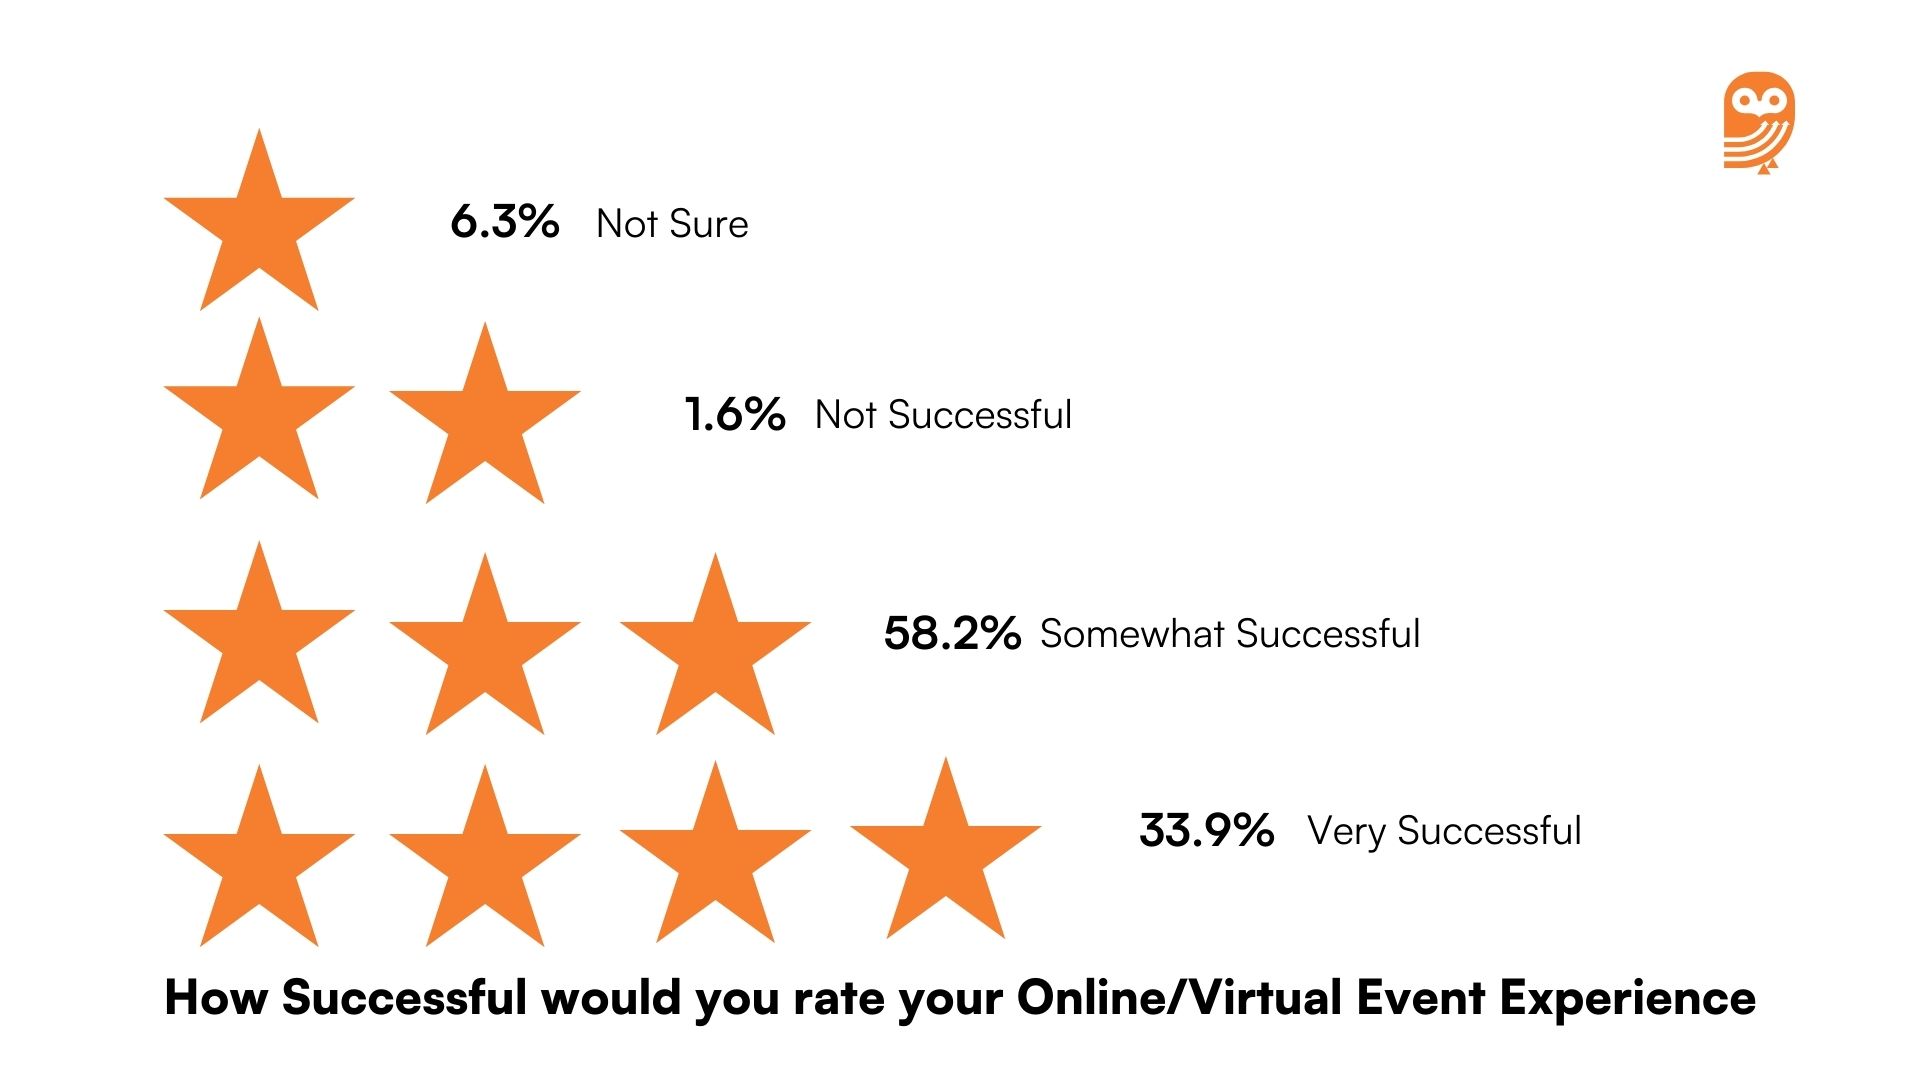
- 58.2% of marketers would rate online events as somewhat successful. – Anyroad
- 23% of event planners used the Net Promoter Score to measure the success of their hybrid event. – Bizzabo
Source: Kaltura
In-person Event Stats
- In-person events are the number one B2B marketing technique. – LinkedIn
- Only 2% of organizers accept that in-person events can drive sales. – Kaltura
- Nearly 47% of marketers say that in-person events yield the largest ROI. – Splash
- 33% of attendees agree that in-person events offer them fewer opportunities to have 1:1 time with other attendees. – Kaltura
- On average, 97% of marketers are most confident in executing in-person events. – MarketingCharts
- The number of live attendees at in-person events has decreased by 65%. – Emerald
- 6 in 10 B2B marketing leaders say that they plan to use in-person events and these events were also cited as the most effective B2B marketing channel. – LinkedIn
- 80% of marketers say that in-person events are the most trusted marketing channel. – Freeman
- Respondents to AMEX’s 2024 Global Meetings and Events survey said that their meetings and events next year will be either entirely in-person (59%) or hybrid (20%) with the remaining 21% to be conducted virtually. – AMEX GBT
- 51% of leaders prefer to promote their thought leadership at in-person events. – Bospar
Technology and Platform Stats
- 34% of attendees would like to have on-demand content during and after the event. – Kaltura
- 58% of attendees want more livestream offerings of keynotes and other event content. – Emerald
- 45% of attendees want better online access to sessions. – Emerald
- 59% of companies are planning to increase their investments in event technology. – Splash
- 89% of event organizers plan to invest in data analysis for their events. – Zipdo
- An app is offered for attendees to use during the event by over 37% of planners. – Zipdo
- Event technology users have a 22% higher satisfaction rate compared to the ones who carry out an in-person event. – Zipdo
- 56% of marketers plan on increasing the use of generative AI during their in-person events. – LinkedIn
- 48% of marketers want to use generative AI in their digital and hybrid events. – LinkedIn
- Though a lot of platforms can facilitate online events, Zoom is far ahead of the competition with a 50.3% market share. Other alternatives are Microsoft Teams (12%) and Facebook Live (9.4%). – Anyroad
- Over 85% of event planners use event management software to plan events. – Zipdo
- According to the MPIs Meeting Outlook Survey, 22% say that they use generative AI regularly but 48% of them don’t use it at all. – Meeting Professional International
- 67% of organizers say that they have changed or have plans to change their event software. – Bizzabo
Success Measurement Stats
- The top 3 success metrics for event planners are an Increase in overall attendance, new accounts, and a higher attendee-to-exhibiter ratio. – Emerald
- The top success metric for B2B providers/vendors is getting new accounts engaged closely followed by quality of leads and revenue generated on deals. – Emerald
- The top metric used to measure event success for attendees is the number of new business opportunities generated followed by an increase in community engagement and increased brand awareness. – Emerald
- The primary method for 45% of marketers for measuring event success is measuring engagement numbers which considers total registration and attendance numbers, followed by attendee satisfaction (24.9%). – Anyroad
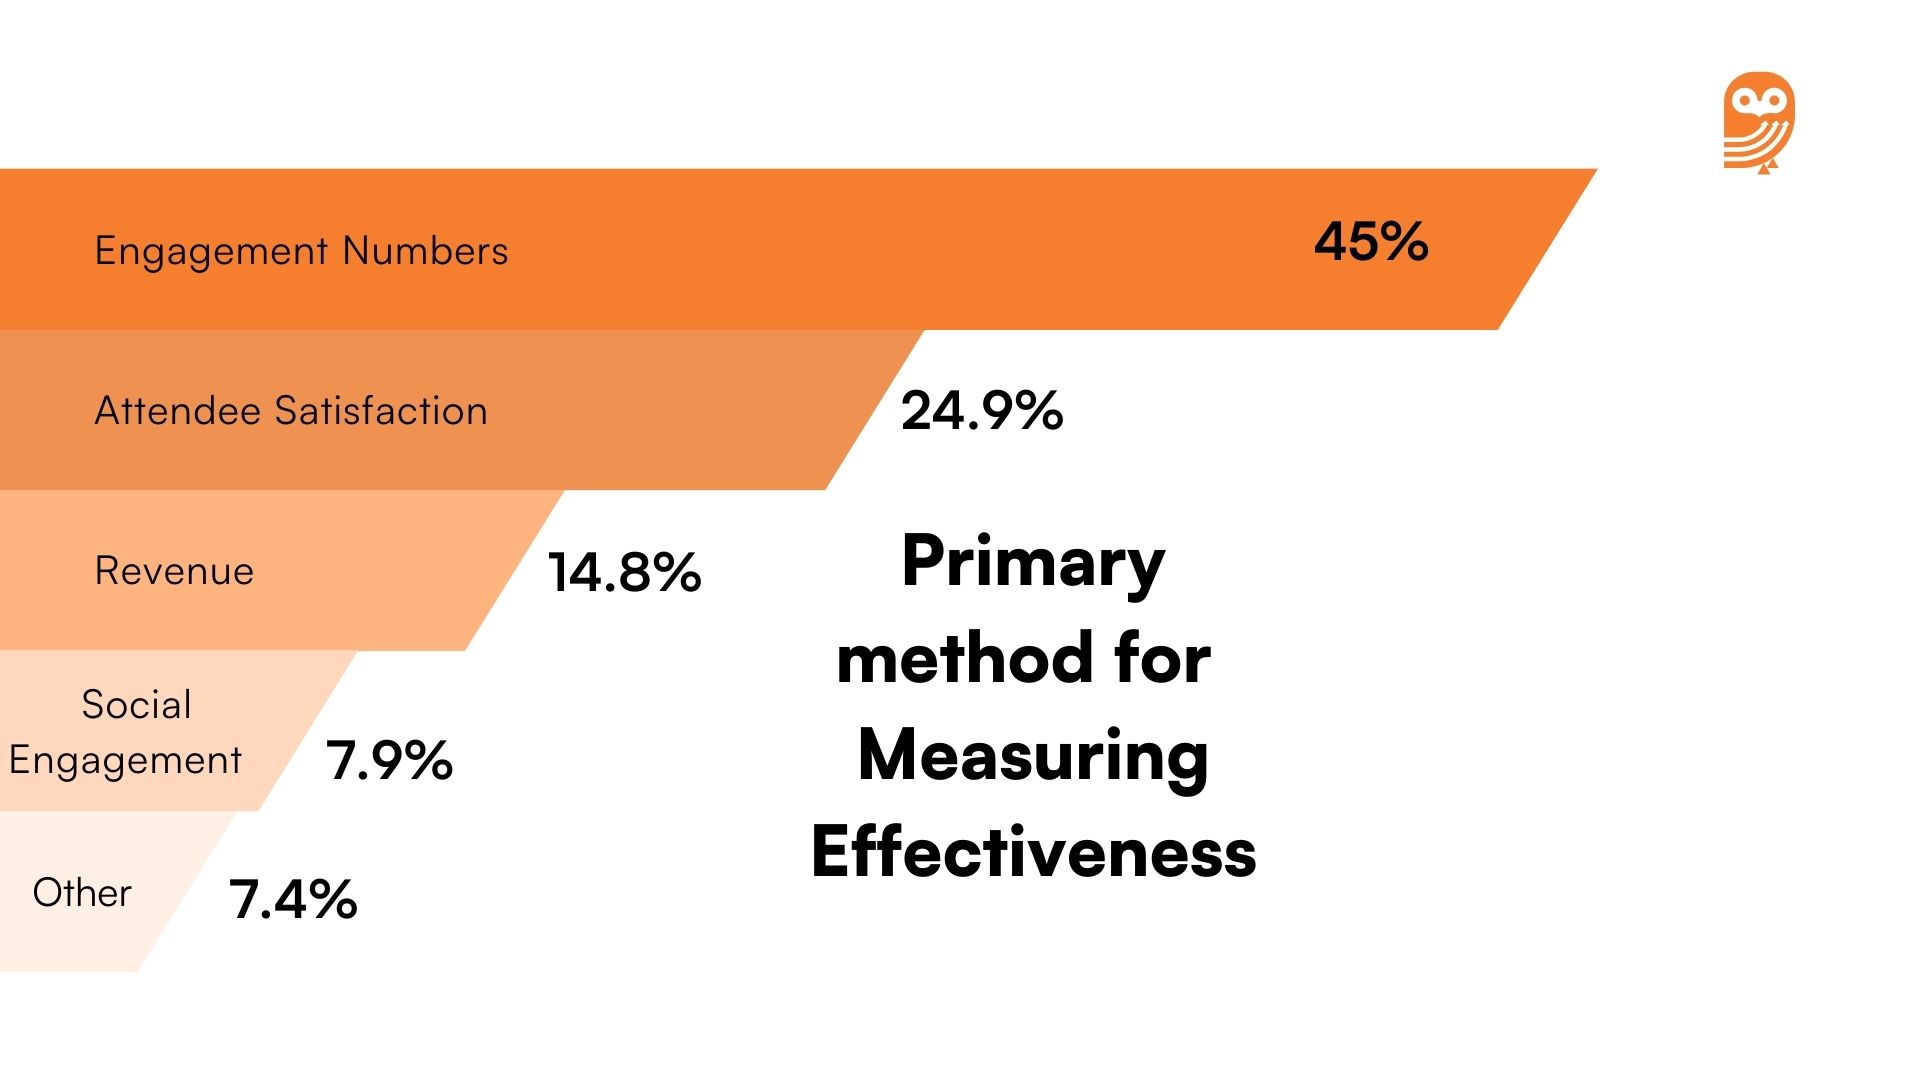
Source: AnyRoad
Engagement Attendee Stats
- According to Kaltura, 7% of attendees indicated that they are satisfied by attending virtual events. – Kaltura
- 45% of event marketers say that they run online events to create more engagement among the people. – Anyroad
- Most of the marketers (51.8%) run up to 4 virtual events per month. Whereas 28.8% of marketers run 5-10 events per month and only 8.9% of them run more than 20 events per month. – Anyroad
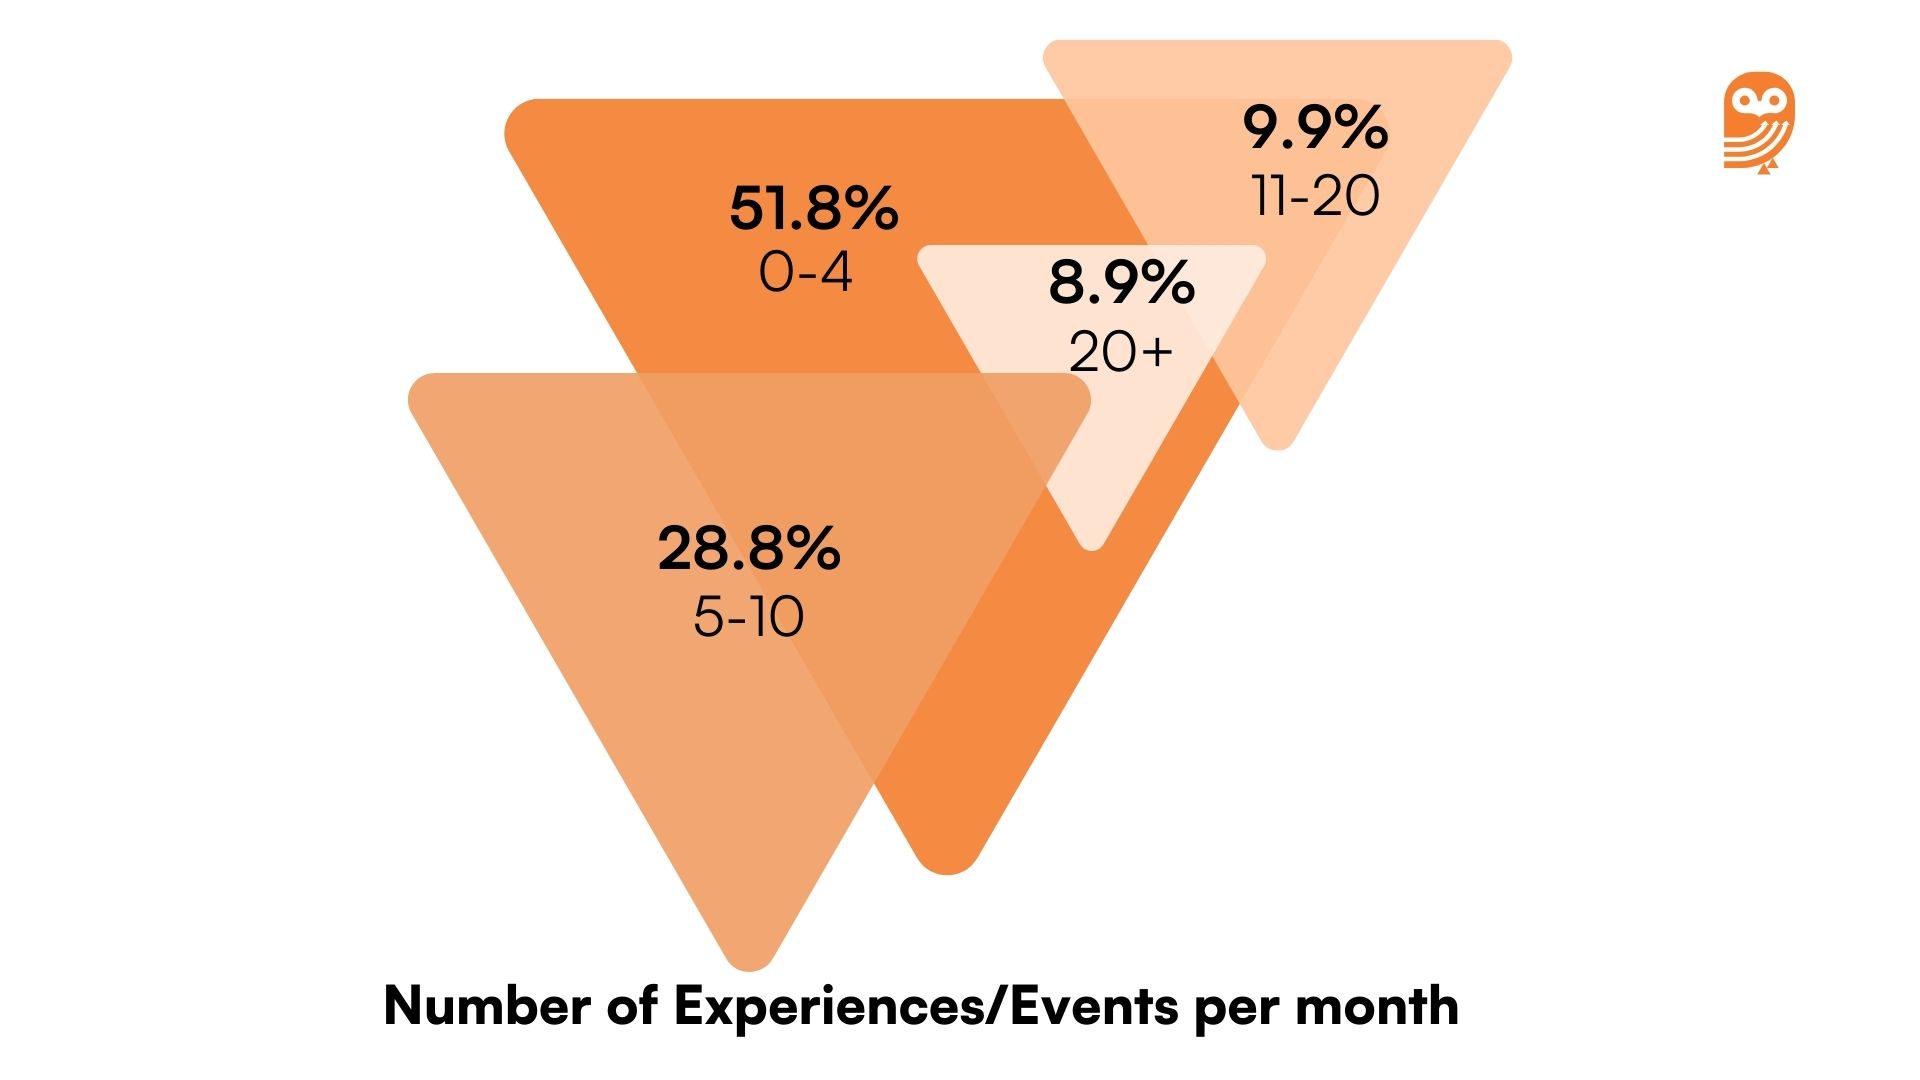
Source: AnyRoad
Event Budget and Marketing Stats
- 23% of event practitioners say that budget constraints are also a hindrance to them. – Splash
- 29% of event planners promote their events through influencer marketing. – Zipdo
- 85% of event planners use email marketing to promote their events. – Zipdo
- 70% of companies are willing to increase their total marketing budgets in 2024. – Splash
- According to a survey by Gartner, 71% of CMOs say that they don’t have sufficient budget to fully execute their strategies. – Gartner
- According to virtual event statistics, 75% of the budget goes to technology instead of food, venue, staff, refreshments, and travel. – Statista
Registration, Event Goals, Data and ROI Stats
- 47.1% of registration buttons on high-converting events appear at the top of an event page. – Splash
- 94.6% of high-performing events ask fewer than 20 questions in their registration forms. – Splash
- 80% of companies agree that their company would benefit from an event-led growth approach. – Splash
- The top goal for 32% of organizers is to build new relationships through in-person events. – Kaltura
- For 28% of organizers, the goal for in-person events is to increase brand awareness. – Kaltura
- 86% of companies are able to directly attribute events to a company’s revenue. – Splash
Gen Z Event Marketing Stats
- Around 2 in 3 (65%) Gen Zs say that business events are relevant to them. (- Convene
- When attending an event 73% of Gen Z attendees prioritize career and networking opportunities. Few others were interested in workshops (57%), education (53%), travel opportunities (51%), professional development (51%) and speakers (51%).- Convene
- Millennials (70%) value experiences over material things, driving the growth of experiential events. – Zipdo
Event Marketing Challenges Stats
- 25% of event practitioners say that lack of human resources is the biggest challenge for them. – Splash
- Other significant challenges faced by practitioners include event marketing best practices (11%), collaboration difficulties (8%), meeting stakeholder expectations (6%) and measuring results (5%). – Splash
- The average no-show rate for paid registrations is 10% and for free registrations is 50%. – Zipdo
- 55% of marketers agree that they are failing to extract the full potential of zero and first-party data from their events. – Forrester
- 53% of marketers agree that their companies are underperforming because they lack lacking event-led growth strategy. – Splash
Source: Splash
Conclusion
The B2B landscape is brimming with opportunities, but going about it is a task. This comprehensive resource which is packed with 111+ powerful B2B event marketing statistics helps you to stay afloat and rise above the competition. By leveraging these insights you can make data-driven decisions, maximize engagement and ROI, and transform your events into strategic powerhouses.
Key Takeaways on B2B Event Stats and Trends
- Event Marketing Definition: A strategic process to promote brands, services, or products through themed exhibits and presentations, conducted both online and in person.
- Importance of Event Marketing: Essential for building brand awareness, generating leads, engaging customers, upselling, and educating prospects.
- Market Growth and Statistics: The B2B event market is projected to reach $36.31 billion by 2026, generating $1.1 trillion in direct spending globally.
- Event Types and Preferences: Online events like webinars are cost-effective and globally accessible, while in-person events like trade shows provide personal interaction and higher ROI.
- Attendee Preferences: Attendees favor expert Q&As, demos, and virtual happy hours, with successful events relying on attracting the right audience and providing compelling content.
- Virtual Events Trends: Virtual events have increased post-2020 due to their convenience and cost-effectiveness, though they are less personal and offer fewer networking opportunities.
- Technological Integration: Increasing use of generative AI and advanced event technologies to enhance event planning and execution, with significant investments in event tech and data analytics.
- Challenges: Practitioners face budget constraints, lack of human resources, collaboration difficulties, and insufficient measurement tools for event success.