Top B2B Marketing Metrics To Know and How To Report on Them
Vivek Goel
January 30, 2025

Table of Contents
Introduction
In the fast-evolving landscape of B2B marketing, measuring success is not just about tracking performance—it’s about gaining actionable insights to drive strategic decisions. Effective measurement ensures that your marketing efforts align with your business objectives, whether it’s lead generation, customer acquisition, or brand awareness. Metrics help in identifying what works and what doesn’t, enabling marketers to optimize their campaigns and justify their budgets. For B2B marketers, where sales cycles are longer and decision-making involves multiple stakeholders, measuring the right metrics becomes even more critical. This blog explores top B2B marketing metrics every marketer should know and provides a comprehensive guide on how to report them effectively to drive business success.
Understanding the Importance of Marketing Metrics in B2B
Marketing metrics are quantitative indicators that help businesses evaluate the effectiveness of their marketing campaigns. For B2B companies, these metrics are crucial in:
- Tracking ROI: Understanding how marketing efforts contribute to revenue growth.
- Optimizing Campaigns: Identifying areas for improvement in real-time.
- Justifying Budgets: Demonstrating the value of marketing to stakeholders.
- Enhancing Customer Journeys: Personalizing strategies to meet the specific needs of B2B buyers.
Essential Top B2B Marketing Metrics
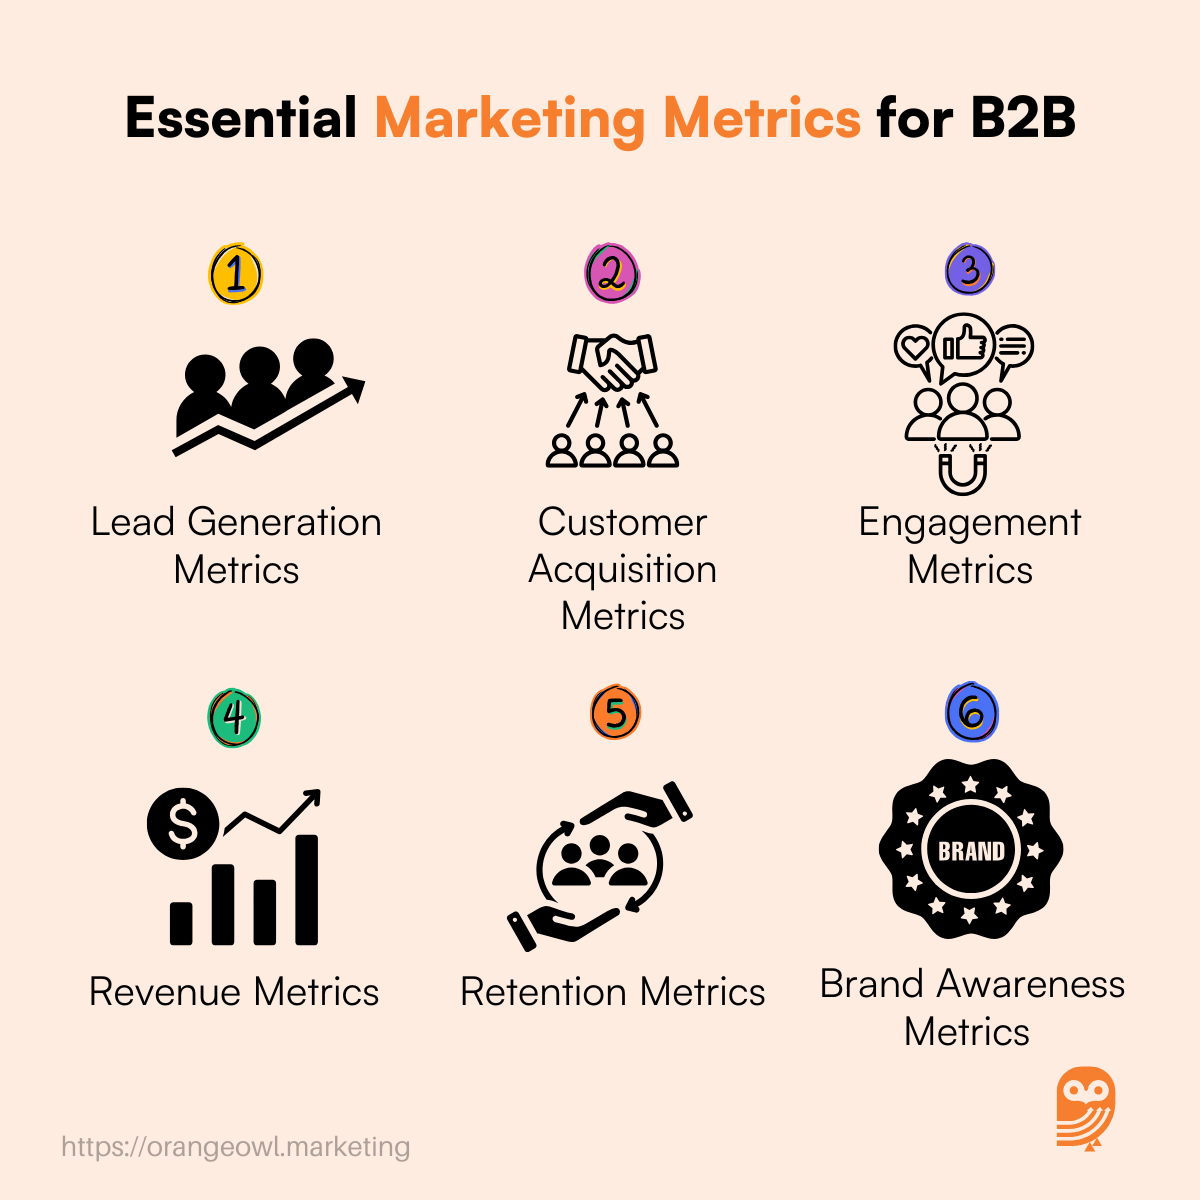
1. Lead Generation Metrics
Marketing Qualified Leads (MQLs) and Sales Qualified Leads (SQLs)
Formula:
- MQLs: Leads that have shown interest in your business and meet certain criteria (such as interacting with content, downloading eBooks, or subscribing to newsletters).
- SQLs: Leads that have been vetted by sales and are considered ready for a direct sales pitch (e.g., they’ve requested a demo or are looking for a solution to a specific problem).
Segregation Example:
- Let’s say your marketing team identifies 100 leads from various sources like email sign-ups, webinar attendees, etc. Out of these, 60 leads meet the criteria for MQLs.
- After evaluating, the sales team finds 30 of these MQLs are actually interested and are now SQLs.
In this case:
- MQLs = 60
- SQLs = 30
The goal is to focus more effort on SQLs as they are more likely to convert into customers.
Cost Per Lead (CPL)
Formula:
CPL=Total Marketing Spend/Total Number of Leads Acquired
Explanation: CPL helps measure how much it costs to acquire a lead through your marketing efforts. It tells you if you’re spending efficiently to generate new leads.
Example: Let’s say you spent $5,000 on a marketing campaign (including ads, content, tools, etc.) and acquired 500 leads.
CPL=5000/500=10
This means the cost to acquire one lead is $10.
Lead Conversion Rate
Formula:
Lead Conversion Rate=(Number of Leads Converted to Customers/Total Number of Leads)×100
Explanation: The lead conversion rate tells you the percentage of leads that eventually become customers. This metric helps assess the effectiveness of your sales process and overall lead quality.
Example: If you had 500 leads, and 50 of them became paying customers:
Lead Conversion Rate=(50/500)×100=10%
This means 10% of your leads converted into customers.
2. Customer Acquisition Metrics
Customer Acquisition Cost (CAC)
Formula:
CAC=Total Marketing and Sales Expenses/Number of New Customers Acquired
Explanation: CAC measures how much you spend to acquire each new customer. It includes all marketing and sales expenses such as advertising, salaries, tools, and other costs involved in the process.
Example: Suppose your company spent $10,000 on marketing and sales over a month and acquired 50 new customers during that time. CAC=10000/50=20
This means your company spent $200 to acquire each new customer.
Sales Cycle Length
Formula:
Sales Cycle Length=Date of Deal Close−Date of First Contact
Explanation: The sales cycle length measures the average time it takes to convert a lead into a paying customer, from the first point of contact to the final purchase. Shorter sales cycles typically indicate an efficient sales process.
Example: Let’s assume a lead first contacts your company on January 1st and the deal is closed on January 31st.
Sales Cycle Length=31 days
This means it took 31 days to close the deal with this particular customer.
Win Rate
Formula:
Win Rate=(Number of Closed Deals/Total Number of Opportunities)×100
Explanation: Win rate measures the percentage of deals won out of the total opportunities or leads your sales team engages with. A higher win rate indicates a more effective sales process.
Example: Suppose your sales team had 100 opportunities in a given quarter, and they successfully closed 25 deals.
Win Rate=(25/100)×100=25%
This means the sales team converted 25% of the opportunities into closed deals.
3. Engagement Metrics
Website Traffic
Formula:
Total Visits: Number of all visits to the website, regardless of whether they are from unique visitors.
Unique Visitors: Number of individual users who visit the website during a specific period.
Session Duration: Average amount of time visitors spend on the website per session.
Explanation: Website traffic metrics help assess how many people visit your site, how often, and how long they stay. It provides insights into the effectiveness of your digital presence.
Example:
- Total Visits = 5,000
- Unique Visitors = 3,000
- Average Session Duration = 2 minutes
Content Performance
Formula:
- Downloads: Total number of times a content asset (like an eBook or white paper) is downloaded.
- Views: Total views for content (videos, blog posts, etc.).
- Shares: Number of times content is shared by users.
CTR (Click-Through Rate):
CTR=(Clicks on Content/Total Impressions)×100
Explanation: Content performance metrics gauge the effectiveness of your content in terms of engagement, user interaction, and distribution.
Example:
- Downloads = 200
- Views = 1,000
- Shares = 50
- CTR = 500/5000×100=10%
Email Marketing Metrics
Formula:
- Open Rate: Open Rate=(Emails Opened/Emails Sent)×100
- CTR (Click-Through Rate): Same formula as for content.
- Bounce Rate: Percentage of emails that could not be delivered.
Explanation: Email marketing metrics measure the success of your email campaigns, including how many recipients engage with the email content.
Example:
- Emails Sent = 10,000
- Emails Opened = 2,000
- Clicks = 300
- Bounce Rate = 5%
- Open Rate=(2000/10000)×100=20%Revenue Metrics
4. Revenue Growth
Formula:
Revenue Growth=(Current Period Revenue−Previous Period Revenue/Previous Period Revenue)×100
Explanation: Revenue growth measures the increase (or decrease) in revenue over a specific period, indicating the financial health of the business.
Example:
- Current Period Revenue = $150,000
- Previous Period Revenue = $120,000
Revenue Growth=(150000−120000/120000)×100=25%
Customer Lifetime Value (CLV)
Formula:
CLV=Average Purchase Value×Average Purchase Frequency×Customer Lifespan
Explanation: CLV estimates the total revenue a customer will generate for your business over the duration of their relationship.
Example:
- Average Purchase Value = $100
- Average Purchase Frequency = 5 times per year
- Customer Lifespan = 3 years
CLV=100×5×3=1500
This means the average customer will bring $1,500 in revenue over their lifetime.
Marketing’s Contribution to Revenue
Formula:
Marketing’s Contribution to Revenue=(Revenue from Marketing-Sourced Leads/Total Revenue)×100
Explanation: This metric shows the percentage of revenue that can be directly attributed to marketing efforts.
Example:
- Revenue from Marketing-Sourced Leads = $50,000
- Total Revenue = $200,000
- Marketing’s Contribution to Revenue=(50000/200000)×100=25%
5. Retention Metrics
Customer Retention Rate (CRR)
Formula:
Customer Retention Rate (CRR)=(Customers at End of Period−New Customers Acquired/Customers at Start of Period)×100
Explanation: CRR measures the percentage of customers your business retained over a specific time period. This is an important indicator of customer loyalty and satisfaction.
Example:
- Customers at the Start of the Period = 1,000
- Customers at the End of the Period = 950
- New Customers Acquired = 200
CRR=(950−200/1000)×100=(750/1000)×100=75%
This means 75% of the customers from the beginning of the period stayed with the business.
Churn Rate
Formula:
Churn Rate=(Customers Lost/Customers at Start of Period)×100
Explanation: Churn rate is the percentage of customers lost during a specific period. It’s the inverse of retention and a critical metric for identifying weaknesses in customer satisfaction or loyalty.
Example:
- Customers Lost = 50
- Customers at the Start of the Period = 1,000
Churn Rate=(50/1000)×100=5%
This means 5% of customers stopped doing business with you during the period.
Net Promoter Score (NPS)
Formula:
NPS=Percentage of Promoters−Percentage of Detractors
- Promoters: Customers who score 9-10 on the NPS survey (likely to recommend your business).
- Passives: Customers who score 7-8 (neutral).
- Detractors: Customers who score 0-6 (unlikely to recommend).
Explanation: NPS measures customer loyalty and satisfaction by asking how likely customers are to recommend your business. It gives insights into how your business is perceived.
Example:
- Total Respondents = 1,000
- Promoters = 700 (70%)
- Detractors = 200 (20%)
NPS=70%−20%=50
An NPS of 50 is considered strong, indicating more loyal customers than detractors.
6.Brand Awareness Metrics
Share of Voice (SOV)
Formula:
SOV=(Brand Mentions/Total Mentions (Brand + Competitors))×100
Explanation: SOV measures the percentage of total brand mentions in your industry compared to your competitors.
Example:
- Your Brand Mentions = 500
- Competitor Mentions = 1,500
SOV=(500/500+1500)×100=25%
Social Media Reach
Formula:
- Follower Growth: Measure the increase in followers over a specific period.
- Impressions: Total number of times content is displayed to users.
- Engagement Rate:
Engagement Rate=(Engagements\Total Impressions)×100
Explanation: Social media reach gauges how effectively your brand reaches and engages its audience on social platforms.
Example:
- Follower Growth = 1,000 new followers
- Impressions = 50,000
- Engagements = 2,000
Engagement Rate=(2000/50000)×100=4%
Search Volume
Formula:
- Search Volume: Measure the number of searches related to your brand name over a specific period.
Explanation: Search volume indicates the popularity and visibility of your brand in search engines.
Example:
- Monthly searches for your brand name = 10,000
How to Report on Marketing Metrics Effectively
1. Define Objectives and KPIs
Start by aligning metrics with your business objectives. For instance:
- Objective: Increase market share.
- KPIs: Website traffic growth, MQLs, and SOV.
2. Choose the Right Tools
Leverage tools that provide real-time and comprehensive data insights:
- CRM Systems: Salesforce, HubSpot.
- Analytics Platforms: Google Analytics, Tableau.
- Marketing Automation: Marketo, Pardot.
3. Segment Your Data
Present data segmented by:
- Channels: Email, social media, PPC, or organic.
- Campaigns: Compare performance across initiatives.
- Customer Demographics: Focus on industry, size, or geographic location.
4. Visualize Data
Use charts, graphs, and dashboards to:
- Highlight key trends.
- Simplify complex data for non-marketing stakeholders.
- Track progress over time.
5. Provide Context
Metrics without context are meaningless. Always:
- Include benchmarks to compare performance.
- Explain anomalies or unexpected trends.
- Highlight correlations and causations.
6. Regularly Review and Adjust
- Schedule periodic performance reviews.
- Adjust KPIs based on changing business goals or market conditions.
Case Studies: Metrics in Action
Case Study 1: Lead Generation Campaign
- Company Example: HubSpot
- Objective: HubSpot, a leader in CRM software, ran a lead generation campaign for their free tools.
- Metrics Tracked: Cost per Lead (CPL), Marketing Qualified Leads (MQLs), and Lead Conversion Rates.
- Outcome: By utilizing A/B testing on their landing pages, HubSpot improved conversion rates by 20%, leading to a significant reduction in CPL and an increase in qualified leads.
Case Study 2: Account-Based Marketing (ABM)
- Company Example: Snowflake
- Objective: Snowflake, a cloud data platform, implemented ABM strategies to target high-value enterprise clients.
- Metrics Tracked: Engagement Rates, Win Rates, and Customer Acquisition Costs (CAC).
- Outcome: Through hyper-personalized content and targeted ads, Snowflake increased its engagement rate by 35% and reduced its CAC, achieving a 40% improvement in win rates among target accounts.
Best Practices for B2B Marketing Metrics Measurement
1. Focus on Metrics That Matter
- Avoid Vanity Metrics: Vanity metrics (e.g., likes or views) may look impressive but don’t directly indicate business growth or success. Instead, focus on metrics tied to revenue, customer acquisition, or retention, as these provide clear insights into how marketing contributes to the bottom line.
- Tie Metrics to Goals: Select KPIs that align with specific business objectives, ensuring that all measured efforts contribute to strategic goals.
2. Integrate Data Sources
- Unified Platforms: Combining data from CRM, analytics, and marketing automation platforms ensures that all team members have access to the same data set. This reduces discrepancies and allows for a holistic analysis.
- Cross-Functional View: Integrated data provides insights into how different marketing channels or campaigns interact, helping identify areas of synergy or improvement.
3. Maintain Data Hygiene
- Regular Updates: Ensure data accuracy by routinely updating records, removing duplicates, and validating information. Clean data prevents incorrect analyses and faulty decision-making.
- Automation Tools: Use tools to automate data cleaning and validation processes for efficiency and reliability.
4. Collaborate Across Teams
- Interdepartmental Collaboration: Align marketing, sales, and customer success teams on key metrics to ensure consistency and collective ownership of results. This fosters a shared understanding of goals and better utilization of data.
- Feedback Loops: Encourage regular feedback between teams to refine metrics and processes based on real-world insights and challenges.
5. Invest in Training
- Upskill Teams: Equip your team with the knowledge and skills to interpret data accurately and use analytics tools effectively.
- Workshops and Certifications: Offer regular training sessions or certifications in data analysis, visualization, or marketing analytics platforms to keep the team updated with industry standards.
These practices emphasize strategic and collaborative approaches to ensure that data-driven decisions lead to effective and efficient marketing campaigns in the B2B context. Let me know if you need more details or examples!
Future Trends in B2B Marketing Measurement
This section highlights the cutting-edge advancements and upcoming trends in how B2B marketers can measure their performance more effectively:
1. AI-Driven Analytics
- Explanation: Artificial Intelligence (AI) tools are increasingly being used to analyze massive datasets, identify patterns, and predict future trends. AI can provide predictive analytics that help marketers anticipate customer behavior, optimize resource allocation, and improve campaign performance.
- Example: A B2B software company uses AI to predict which leads are most likely to convert based on past data, enabling the sales team to prioritize outreach efforts effectively.
2. Real-Time Dashboards
- Explanation: Dashboards that display live data allow marketers to monitor campaigns continuously and make adjustments on the fly. This enables agile decision-making, especially in fast-paced industries or during high-stakes campaigns.
- Example: An enterprise cloud service provider uses a real-time dashboard to track ad campaign performance. When click-through rates drop, they instantly modify their targeting strategy, reducing ad spend waste.
3. Attribution Modeling
- Explanation: Multi-touch attribution models are becoming the standard for understanding the customer journey in B2B, where the buying process involves multiple touchpoints. These models provide insight into which marketing activities contribute the most to conversions.
- Example: A B2B consultancy uses an attribution model to measure the impact of webinars, email campaigns, and LinkedIn ads on lead conversion. This allows them to allocate more budget to high-performing channels.
4. Intent Data
- Explanation: Intent data involves collecting insights about a buyer’s online behavior to gauge their purchasing intent. This enables hyper-targeted marketing campaigns and better alignment between sales and marketing teams.
- Example: A cybersecurity firm monitors third-party intent data to identify businesses searching for “network security solutions.” They then tailor their outreach with personalized content, significantly boosting their response rates.
Conclusion
Measurement is the backbone of any successful B2B marketing strategy. In a competitive marketplace where precision matters, having the right metrics ensures that every effort contributes to your overarching goals. By focusing on lead generation, customer acquisition, engagement, and retention metrics, businesses can gain a 360-degree view of their marketing performance. Moreover, adopting a structured approach to reporting—using the right tools, segmentation, and visualization techniques—helps communicate insights effectively to stakeholders.
As the marketing landscape evolves, keeping an eye on emerging trends like AI-driven analytics, intent data, and real-time dashboards will be crucial. These innovations not only enhance your ability to measure success but also empower you to predict future opportunities. By embracing a data-driven culture, B2B marketers can drive growth, optimize campaigns, and prove the tangible value of their contributions. Ultimately, it is not just about measuring what you have done but leveraging those insights to shape what you do next.
Frequently Asked Questions(FAQs) on Top B2B Marketing Metrics
B2B marketing metrics are quantifiable data points that measure the performance of marketing campaigns, providing insight into the effectiveness of marketing efforts in achieving business objectives. These metrics help marketers assess which strategies are working and where adjustments are needed. They cover a range of factors, including lead generation, customer acquisition, conversion rates, and customer lifetime value (CLV). By analyzing these metrics, companies can make data-driven decisions to improve marketing ROI, align marketing initiatives with business goals, and optimize their efforts over time.
The key difference between B2B and B2C marketing metrics lies in the nature of the customer journey. B2B marketing typically involves longer sales cycles, multiple decision-makers, and more complex products or services. Therefore, B2B metrics often focus on factors like lead qualification, account-based marketing (ABM) performance, customer acquisition cost (CAC), and customer lifetime value (CLV). In contrast, B2C metrics tend to be more focused on volume and emotional engagement, such as conversion rates, click-through rates (CTR), and customer retention. B2B metrics emphasize building relationships and long-term value, while B2C metrics often reflect quicker, transactional decisions.
There are several powerful tools available for tracking B2B marketing metrics, each specializing in different aspects of the marketing funnel:
- Salesforce: A leading CRM tool that helps track sales pipeline, lead management, and customer relationships. It’s crucial for measuring metrics like conversion rates, lead velocity, and sales cycle length.
- HubSpot: This inbound marketing platform provides analytics for lead generation, website traffic, email campaigns, and more. It’s a great tool for measuring lead nurturing and customer acquisition metrics.
- Google Analytics: Primarily used for tracking website performance, including traffic sources, bounce rates, conversion rates, and user engagement. It’s vital for monitoring digital presence and content performance.
- Marketo: A marketing automation platform that helps track lead generation, email campaign performance, and account engagement, providing insights into customer behavior and lead nurturing effectiveness.
These tools can work together to track key performance indicators (KPIs) at every stage of the customer journey, from awareness to conversion.
Segmentation is crucial in B2B marketing because it allows marketers to categorize and analyze data based on specific characteristics, such as industry, company size, or geography. This targeted approach ensures more personalized marketing efforts and helps identify trends within different market segments. By segmenting their audience, B2B marketers can measure the effectiveness of their campaigns across various demographics, allowing for better resource allocation and more tailored strategies. Segmentation improves reporting accuracy by enabling marketers to focus on the most valuable customer groups and optimize strategies accordingly.
Ensuring the accuracy of B2B marketing metrics requires a combination of consistent tracking, data validation, and integrating multiple data sources. Here’s how marketers can achieve accuracy:
- Data Validation: Periodically review and clean data to eliminate errors or inconsistencies that may arise from faulty tracking setups or incorrect data entry.
- Consistent Tracking Methodologies: Use standardized tracking methods across campaigns, ensuring that metrics are measured consistently over time and can be reliably compared.
- Data Integration: Integrating data from various platforms (CRM, marketing automation tools, website analytics) helps create a unified view of the customer journey, providing a more accurate picture of campaign performance.
By following these steps, marketers can reduce the risk of discrepancies and increase the reliability of their metrics.
Multi-touch attribution (MTA) is a method of assigning value to each touchpoint a customer interacts with throughout their buying journey. Unlike single-touch attribution, which credits only one touchpoint (e.g., first click or last click), MTA evaluates the contribution of every interaction, from initial awareness to final conversion. This approach is especially important in B2B, where the sales cycle is longer and involves multiple decision-makers. MTA helps marketers understand which channels and touchpoints are most influential in converting leads, enabling them to allocate resources more effectively and optimize their marketing strategies.
Several companies have effectively used B2B metrics to drive success:
- HubSpot: HubSpot uses metrics like customer acquisition cost (CAC), lead conversion rates, and customer engagement to refine their marketing strategies and improve their inbound marketing campaigns.
- Snowflake: Snowflake employs account-based marketing (ABM) metrics and customer lifetime value (CLV) to personalize their outreach efforts and ensure they are targeting high-value accounts.
- Salesforce: Salesforce tracks lead velocity rate, sales cycle length, and customer retention to optimize their sales and marketing efforts. They use these metrics to ensure that campaigns align with their business goals and generate measurable growth.
These companies showcase the power of B2B metrics in improving campaign performance and achieving business success through data-driven insights.
Measuring brand awareness in B2B marketing involves assessing how well a company’s brand is known within its target market. Common metrics used include:
- Share of Voice (SOV): This measures how much of the conversation in a given market is about your brand compared to competitors.
- Social Media Reach: The total number of people who have seen your content on social platforms.
- Search Volume Trends: The frequency with which your brand is searched for on search engines, which reflects the level of interest or awareness in your brand.
By monitoring these metrics, B2B marketers can track how their brand is perceived and the effectiveness of their efforts in creating visibility.
Artificial Intelligence (AI) is revolutionizing B2B marketing measurement by enhancing the accuracy and efficiency of data analysis. AI-powered tools can analyze vast amounts of data quickly, identifying patterns and trends that might not be immediately apparent. Here’s how AI impacts B2B marketing:
- Predictive Analytics: AI can forecast customer behavior and future trends based on historical data, helping marketers make proactive decisions.
- Automated Data Analysis: AI can automatically process and analyze data from multiple sources, saving time and ensuring that insights are delivered in real-time.
- Uncovering Hidden Insights: AI helps marketers identify customer segments, preferences, and trends that may not be visible through traditional methods, leading to more personalized and effective campaigns.
AI allows marketers to stay ahead of trends, optimize campaigns, and improve decision-making through actionable insights.
Real-time dashboards provide a live, visual representation of campaign performance, offering immediate insights into key metrics such as engagement, conversions, and return on investment (ROI). These dashboards help B2B marketers by:
- Enabling Quick Adjustments: Marketers can identify issues or opportunities in real-time and adjust campaigns for better performance.
- Improving Resource Allocation: With live data, marketers can allocate resources more effectively, focusing on high-performing areas of a campaign.
- Enhancing Collaboration: Real-time dashboards offer a shared view of performance, enabling teams to collaborate and make data-driven decisions together.
In fast-paced B2B environments, real-time dashboards ensure that marketers are always in tune with campaign performance and can make timely improvements.


