What is ROAS (Return on Ad Spend)?
ROAS stands for Return on Ad Spend, and it’s one of the most important metrics in digital marketing. It tells you how much money you’re getting back for every rupee or dollar spent on advertising. It’s simple, actionable, and can make or break your growth strategy.
For example, a ROAS of 800% means you’re earning ₹8 in revenue for every ₹1 you invest in ads. The higher your ROAS, the more efficiently your ads are converting spend into sales.
How to Calculate ROAS
The basic ROAS formula is easy to remember and quick to use.
Let’s say you want to measure how well your latest campaign performed. All you need to do is divide the revenue generated from ads by the total ad spend, then multiply by 100.

ROAS Formula:
ROAS = (Total Revenue from Ads ÷ Total Ad Spend) × 100
Example:
- Ad Revenue: ₹10,000
- Ad Spend: ₹2,000
- ROAS = (10,000 ÷ 2,000) × 100 = 500%
This means for every ₹1 spent, you earn ₹5 back.
What’s a Good ROAS?
There’s no universal number that defines a “good” ROAS—it depends on your business model, margins, and growth goals. That said, here are some general benchmarks:
- 400% ROAS is a common minimum goal
- 800%+ ROAS is considered excellent
- Businesses with higher product margins can afford lower ROAS and still be profitable
- Subscription or SaaS models may optimise for lifetime value rather than just initial ROAS
What matters most is whether your ROAS supports sustainable growth.
Why ROAS Matters
Whether you’re running a small pilot campaign or a full-scale digital push, tracking ROAS ensures you’re not throwing money into the void. It acts as your marketing compass, helping you adjust budgets, messaging, and strategy based on real performance.
ROAS helps you:
- ✅ Identify your most profitable campaigns
- ✅ Cut down on wasted ad spend
- ✅ Make better budgeting decisions
- ✅ Align marketing performance with business outcomes
Without it, you’re flying blind.
Metrics That Affect ROAS
Your ROAS doesn’t exist in isolation. Several related metrics influence it. Understanding and improving these can have a direct impact on your returns:
- Customer Acquisition Cost (CAC): Lower CAC = higher ROAS
- Conversion Rate: The more users who convert, the higher your return
- Average Order Value (AOV): Bigger baskets increase revenue per click
- Click-Through Rate (CTR): Stronger creatives and targeting boost engagement
Related Metrics to ROAS
ROAS is a powerful metric, but it becomes even more insightful when viewed alongside other key performance indicators. Here are a few important metrics that work hand-in-hand with ROAS:
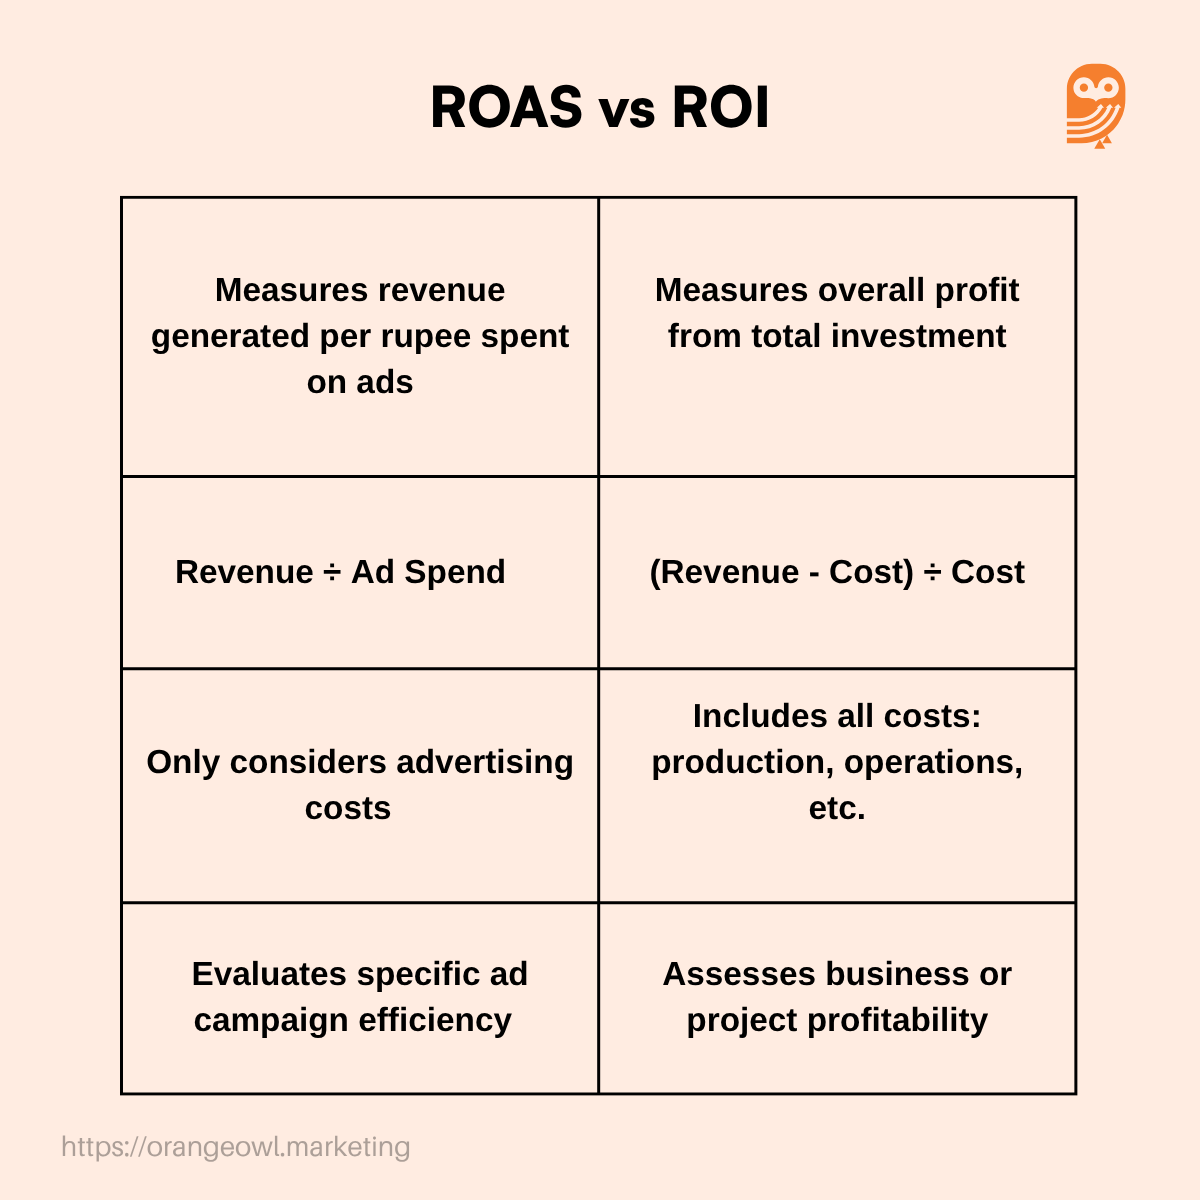
1. ROI (Return on Investment)
While ROAS focuses only on ad spend, ROI takes into account all business expenses (like product costs, tools, and team salaries) to measure your overall profitability.
2. CPA (Cost Per Acquisition)
This metric tells you how much it costs to acquire a customer or lead. A lower CPA usually means you’re generating conversions more efficiently.
3. CAC (Customer Acquisition Cost)
Similar to CPA but broader, CAC includes your entire sales and marketing spend. It’s especially important for SaaS and subscription businesses that track long-term growth.
4. LTV (Customer Lifetime Value)
LTV estimates how much revenue a customer will generate over their entire relationship with your brand. It helps you understand if your ROAS and CAC are sustainable in the long run.
5. Conversion Rate
This measures the percentage of users who complete a desired action, like making a purchase or signing up. Improving conversion rates can directly boost your ROAS.
What Can Bring Your ROAS Down?
Sometimes your ROAS might dip, and it’s important to pinpoint the root cause rather than just blame the platform. Here are some factors that typically bring it down:
- Poor ad creatives that don’t grab attention
- Generic or misaligned targeting leading to low-quality traffic
- Slow or confusing landing pages that kill conversions
- Long or delayed sales cycles, where the impact of ads is not immediate
Understanding these variables gives you levers to pull when performance drops.
How Marketing Teams Use ROAS
ROAS is more than a health metric—it’s a decision-making tool. Performance marketers and CMOs use it to:
- Evaluate which platforms (Google, Meta, LinkedIn) are generating true ROI
- Compare performance across regions, cohorts, or campaigns
- Scale what’s working and pause what isn’t
- Forecast future marketing investments with confidence
Using a ROAS Calculator
A ROAS calculator makes all this faster. Simply plug in:
- Your total ad spend
- The total revenue generated from those ads
and instantly see the efficiency of your campaign. If you’re using estimated figures, just factor in your average conversion rate and sale value. It’s a quick way to validate assumptions and guide optimisations.
How to Improve Your ROAS
Improving ROAS isn’t about spending less—it’s about spending smarter. Start by analysing each part of the customer journey, from impression to checkout. Then make improvements that increase returns at every stage:
- Improve ad targeting: Focus on high-intent or lookalike audiences
- A/B test creatives: Iterate messaging, visuals, and CTAs
- Refine landing pages: Make them faster, clearer, and more persuasive
- Increase AOV: Upsell or bundle to grow revenue per customer
- Use retargeting: Re-engage warm audiences who already know you
Even small tweaks can add up to a major ROAS lift.
When Should You Use ROAS?
ROAS is most valuable when you’re actively running performance campaigns, especially paid media. It helps:
- Marketing teams decide where to double down or pivot
- Founders and CFOs align spending with business outcomes
- Investors understand if customer acquisition is sustainable
- SaaS and D2C teams make fast, data-backed marketing decisions
If you’re not tracking ROAS, you’re missing critical insights about what’s driving your revenue.
How Orange Owl Helps You Improve ROAS
At Orange Owl, we work with B2B startups and growing brands to improve their ROAS through a mix of creative testing, audience refinement, landing page design, and funnel optimisation. We don’t just help you track the numbers—we help you improve them. Our approach ensures every ad rupee you spend is part of a larger strategy that aligns with your long-term business goals.
If you want to try other tools